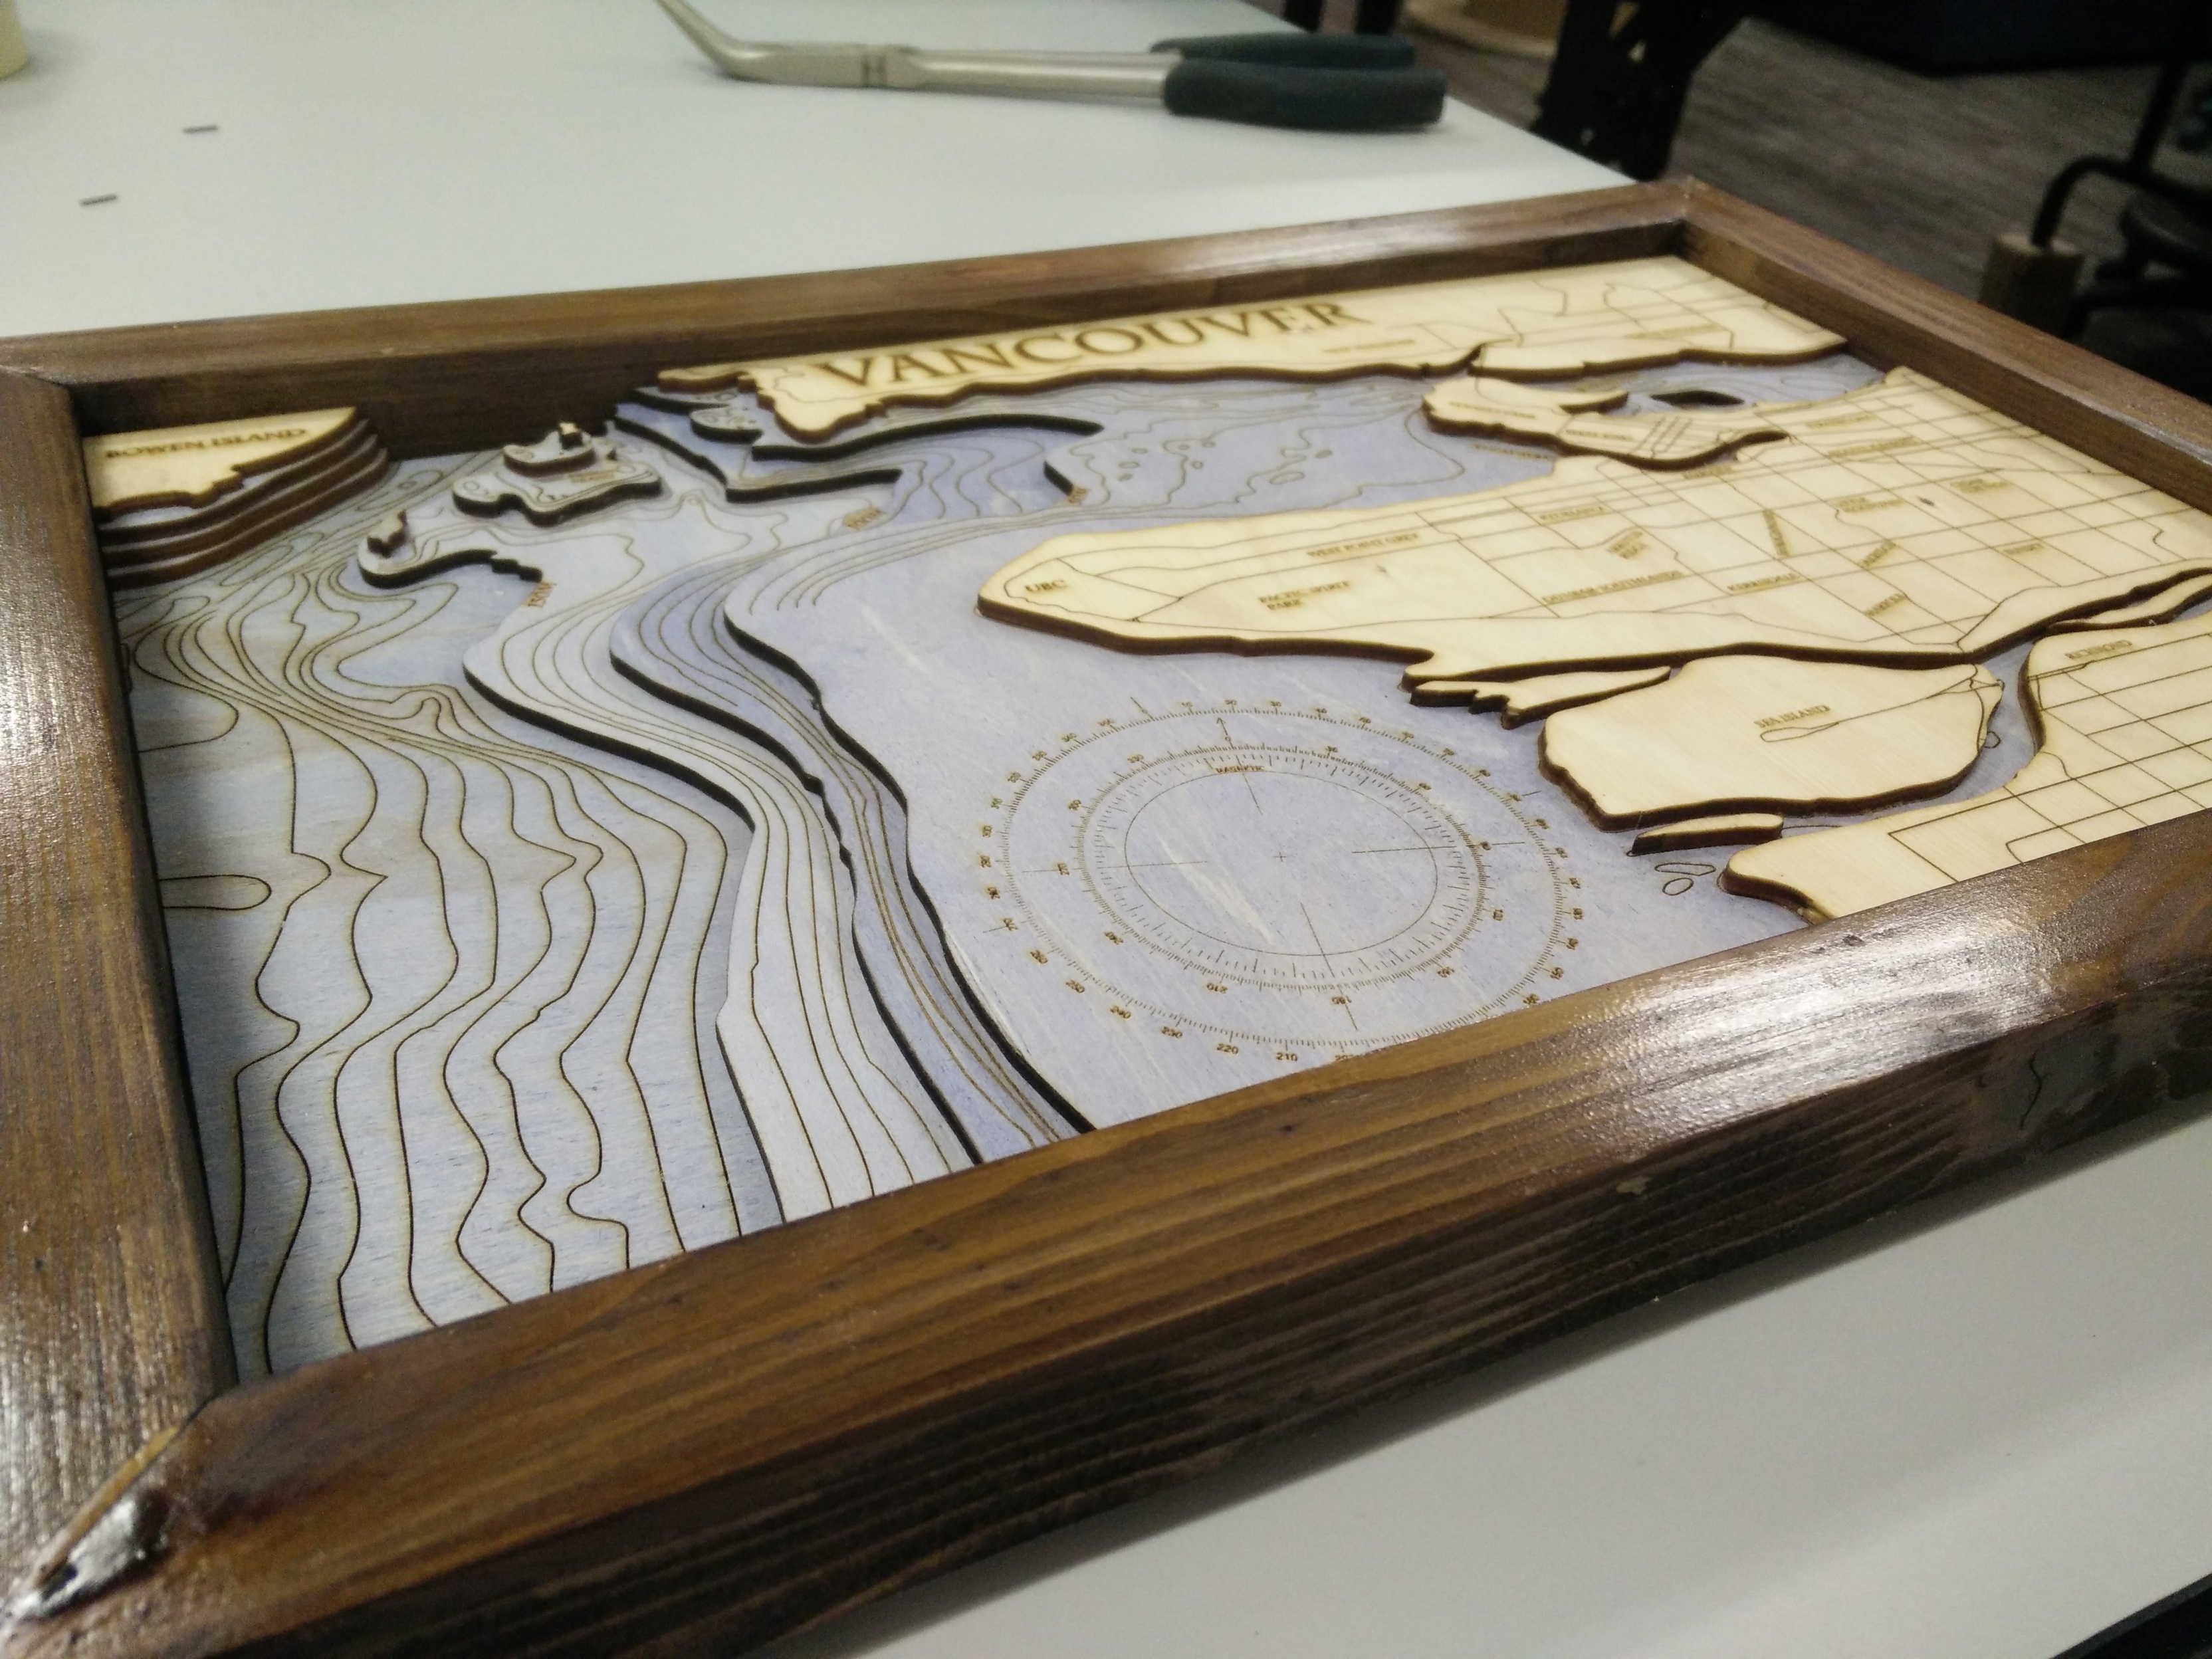
I finally finished my map of Vancouver the other day and I wanted to share it with you guys. Overall, I am really pleased with how it turned out. It was a gift for my partner - she was really excited to receive it!
The reason I am writing this post is to document how it was done and document some of problems I ran into (in case anyone wants to make something similar)
Getting the data ready
The map is created using a combination of bathymetric data and open street maps(OSM). qgis is the FOS GIS program I used to combine the different data sets in order to produce the vectors I needed to eventually laser cut the plywood. The bathymetric data from the government of Canada is really well formatted. Using search filters in qgis, I was able to select all vectors that delineated depths at 50m increments. This formed the cut lines for the plywood. The dataset also had a layer denoting the coastline of the lower mainland. This formed the cut lines for the top layer. The remaining contours are in 10m increments and were separated into different layers depending on which layer of plywood they would be engraved into.
I wanted to make sure that the ‘land’ and ‘water’ components of the map had a similar amount of complexity, therefore when creating the vectors for Vancouver, I opted to only map out arterial roads. OSM data has all roads map to the key ‘highway’; the type of road is mapped to different values depending on it’s importance. I ended up selecting all roads that matched the following search expression.
(“highway” = ‘primary’) OR (“highway” = ‘primary_link’) OR (“highway” = ‘secondary’) OR (“highway” = ‘secondary_link’)
Inversion of the selection allowed me to get rid of all vectors in the database which were not major roads. Easy right? I thought so until I started to look closer at what was left behind. Our road network in Vancouver is fairly complex when you start looking at all the on-ramps, turning lanes, split roads, etc. OSM should classify a lot of these roads as ‘secondary_link’, but since it is essentially a wiki, most of the data was misclassified. So I imported all of it and got ready to prune data later.
I exported everything to dxf and opened it up with Adobe Illustrator. This is when my thoughts were confirmed that OSM’s dataset is pretty much garbage. All roads are composed of very small segments of vectors. For example, Granville St. was broken into more than 40 segments. If attempting to load this into the laser cutter software, the cutter will make a whole bunch of little cuts in whatever way the software generated the g-code. This caused the roads to not look very smooth. Therefore, I spent a lot of time joining vectors and cleaning up all of the misclassified road data. This was several hours of my time.
I would suggest using Vancouver’s GIS data next time. It is very clean, but comes in a different projection system than OSM. There is a way to convert the projection system, but I couldn’t figure it out (I didn’t really try that hard though…). Failure to convert projection systems gives you vectors that don’t map well to the bathymetric data.
I finally got it all set up in Illustrator how I would like it.
Building the map
Materials
- 4’x8’ 1/8" Baltic Birch plywood
- 1"x6"x8’ Cedar board
- Deep ocean water-based stain
- Espresso oil-based stain
- Glossy varathane (spray can)
- Wood glue
- Wood conditioner
- Wood filler
- Mineral spirits/turpentine/alcohol (solvent)
Tools
- Laser Cutter
- Band saw
- Skill saw
- Sand paper (100 and 220 grit)
- Sand paper block
- Clamps (all sorts!!)
- Miter clamps
- Paint brush
The physical map is comprised of five layers of plywood glued together with ordinary woodglue and framed with 1"x1" cedar boards. All layers were stained individually BEFORE engraving with the cutter. I want to emphasize that staining them before is really important. If trying to do it the other way, then the stain reduces the contrast of the engraved lines quite substantially.
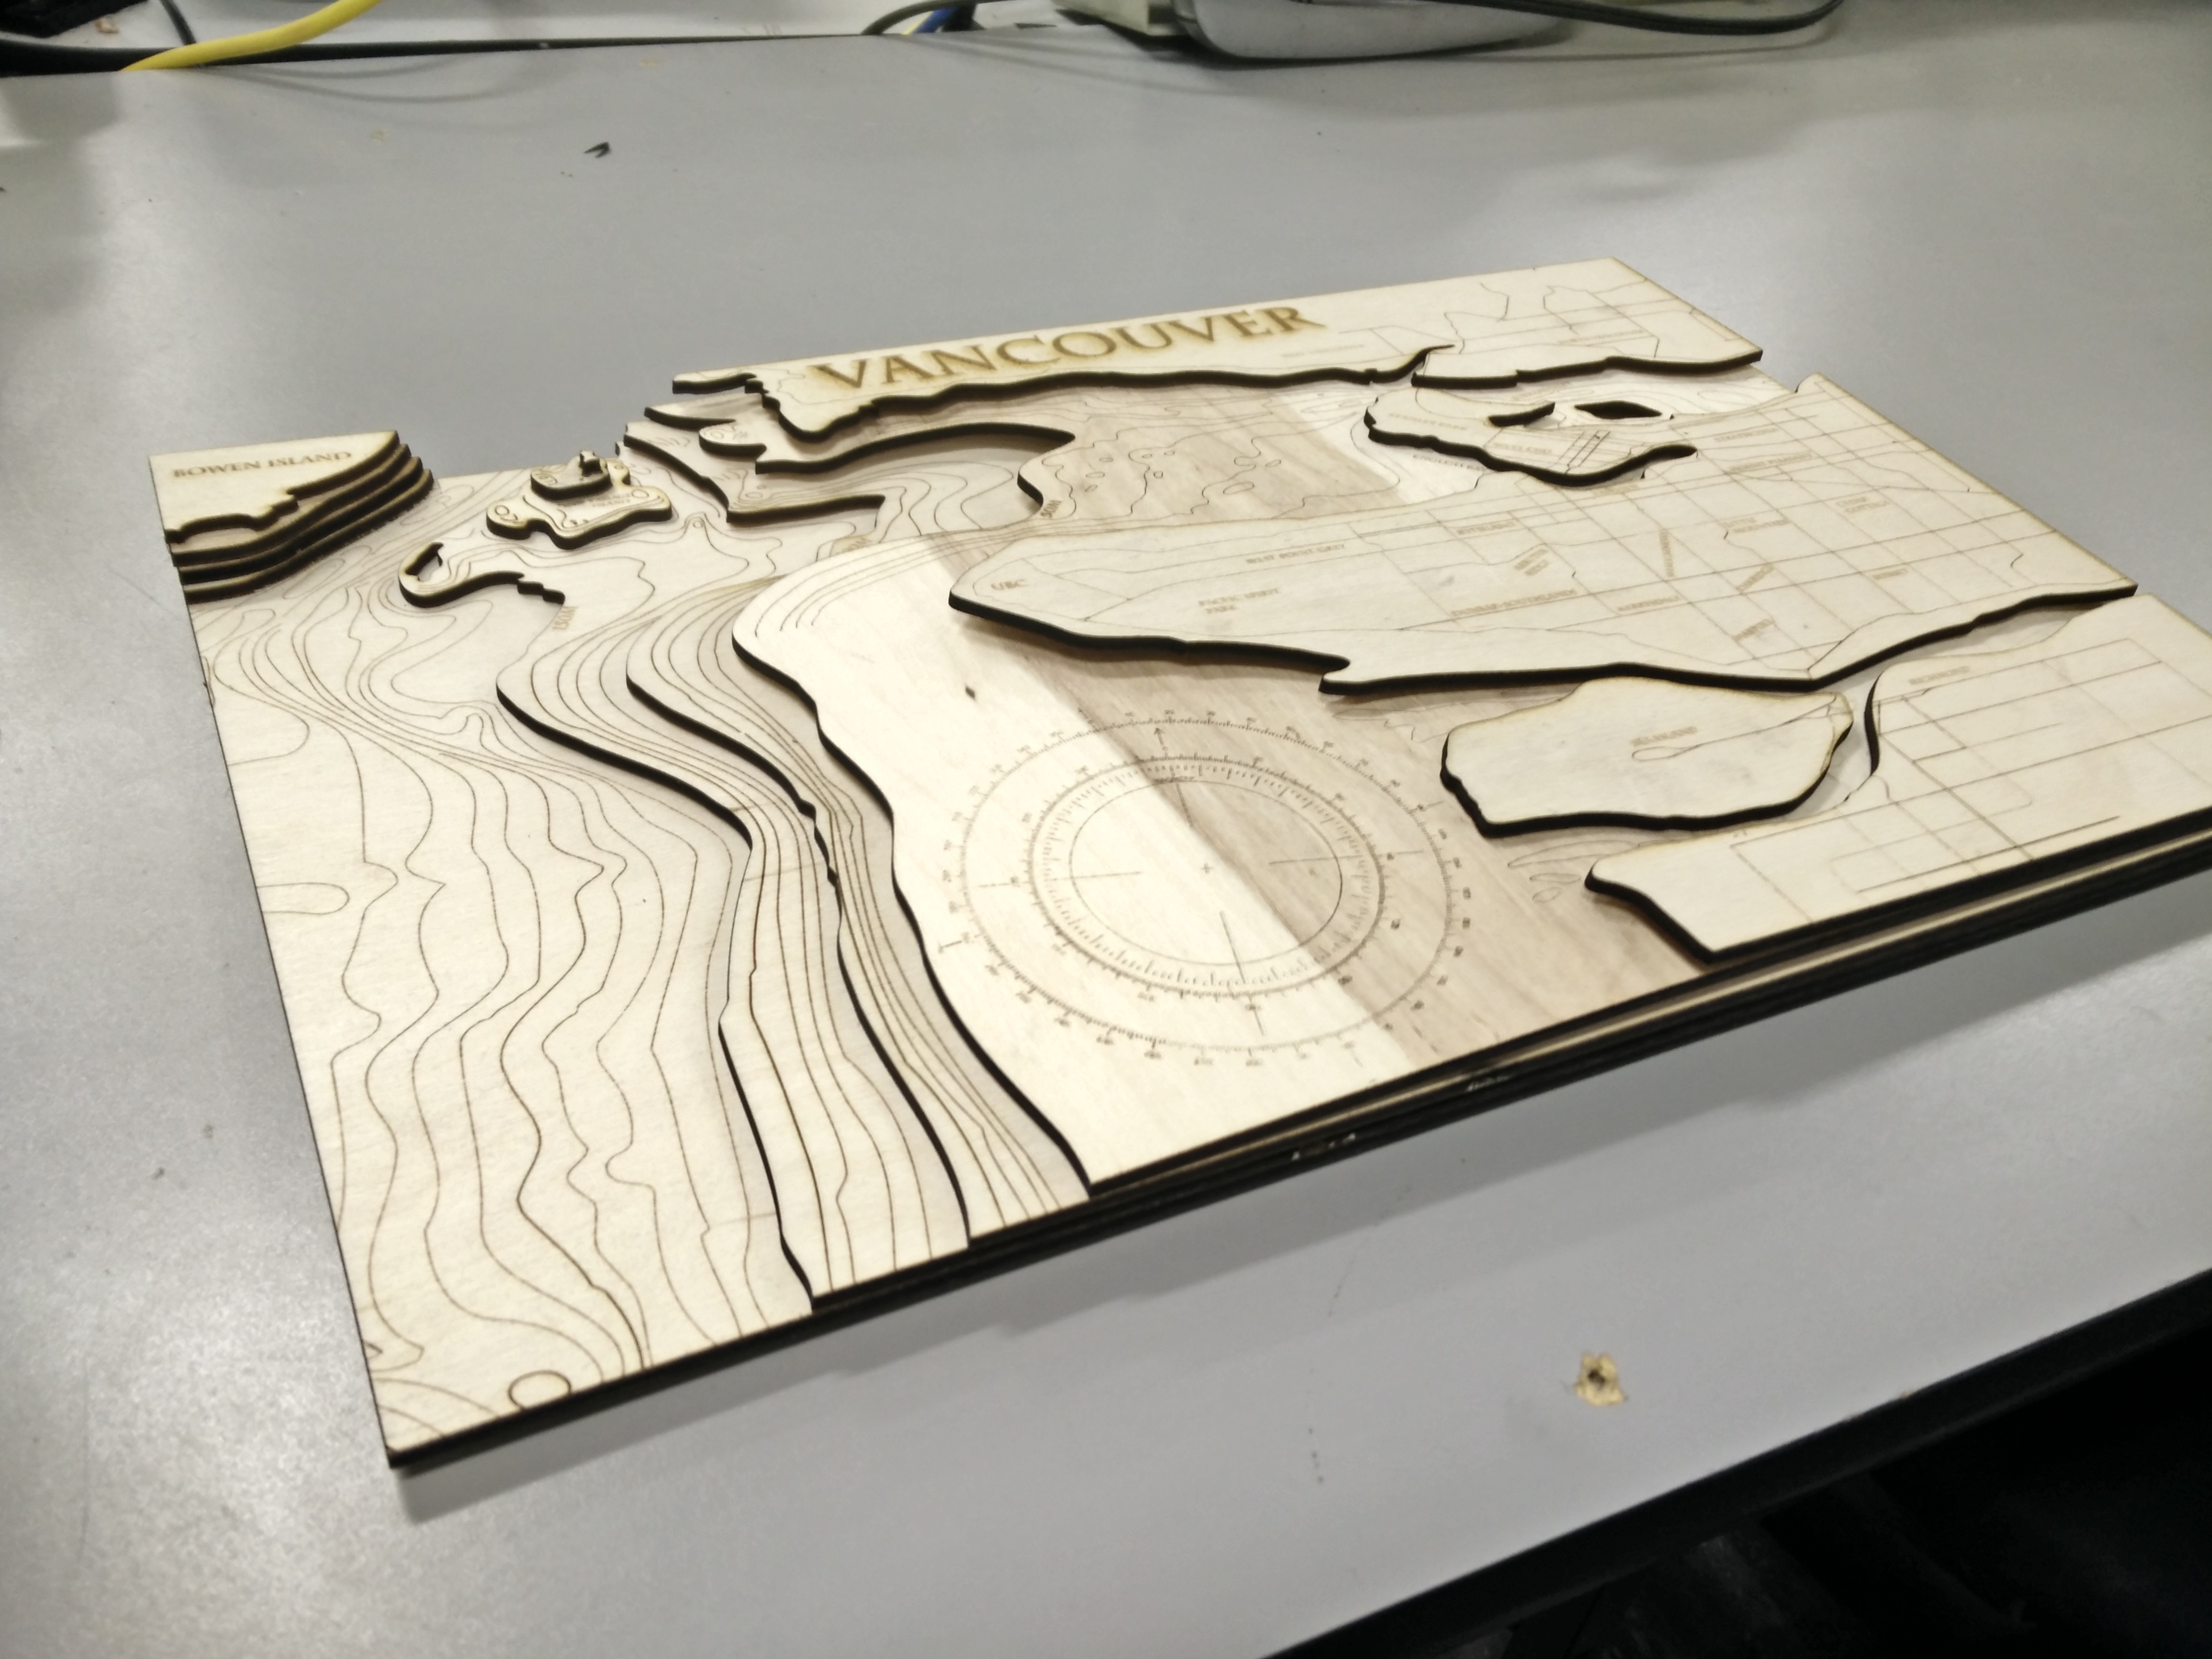
Here is a photo of my first attempt. I was pretty pleased when I finished all this cutting and pretty devastated when the stain erased a lot of the lines.
When staining your wood, I would recommend always using wood conditioner for softwoods(conifers) like cedar or diffuse-porous hardwoods like birch. It seems to give you a much more uniform color with the tradeoff of making the color lighter.
The blue of the ocean was made by diluting the blue stain I had with about 20:1 water-stain ratio. The thing I would do differently next time is to be precise. I didn’t make enough stain the first time and had to make more, but I didn’t really measure anything which means some of the layers have different shades of blue. Meh.
The land was stained with something I found in the back of my closet (no idea what color or brand).
I opted to not varnish the blue plywood since I found it muted the blue colors significantly. This is probably because I used an inferior water-based stain. The drawback to this is that I expect the map to degrade quicker over time as the wood oxidizes and the oils in people’s skin eat at the wood. Oil-based stain is probably the way to go next time. Just do a light layer though on since it needs to be laser cut! Fumes = bad. A gentle reminder that paint should not be used with the laser cutter either.
Once all the pieces were cut out, they were glued to each other using clamps and the anvil for weight. The entire map was then glued onto a piece of laser cut plywood that was 1/2" larger in both directions. This is used to secure the map to the frame (more on this later)
The frame would be an optional component if you planned this properly from the beginning since framing can be very affordable in standard sizes. Sadly I made the map 14"x9" - not really a standard… However, I learned a whole bunch of new skills by taking the opportunity to make my own frame!
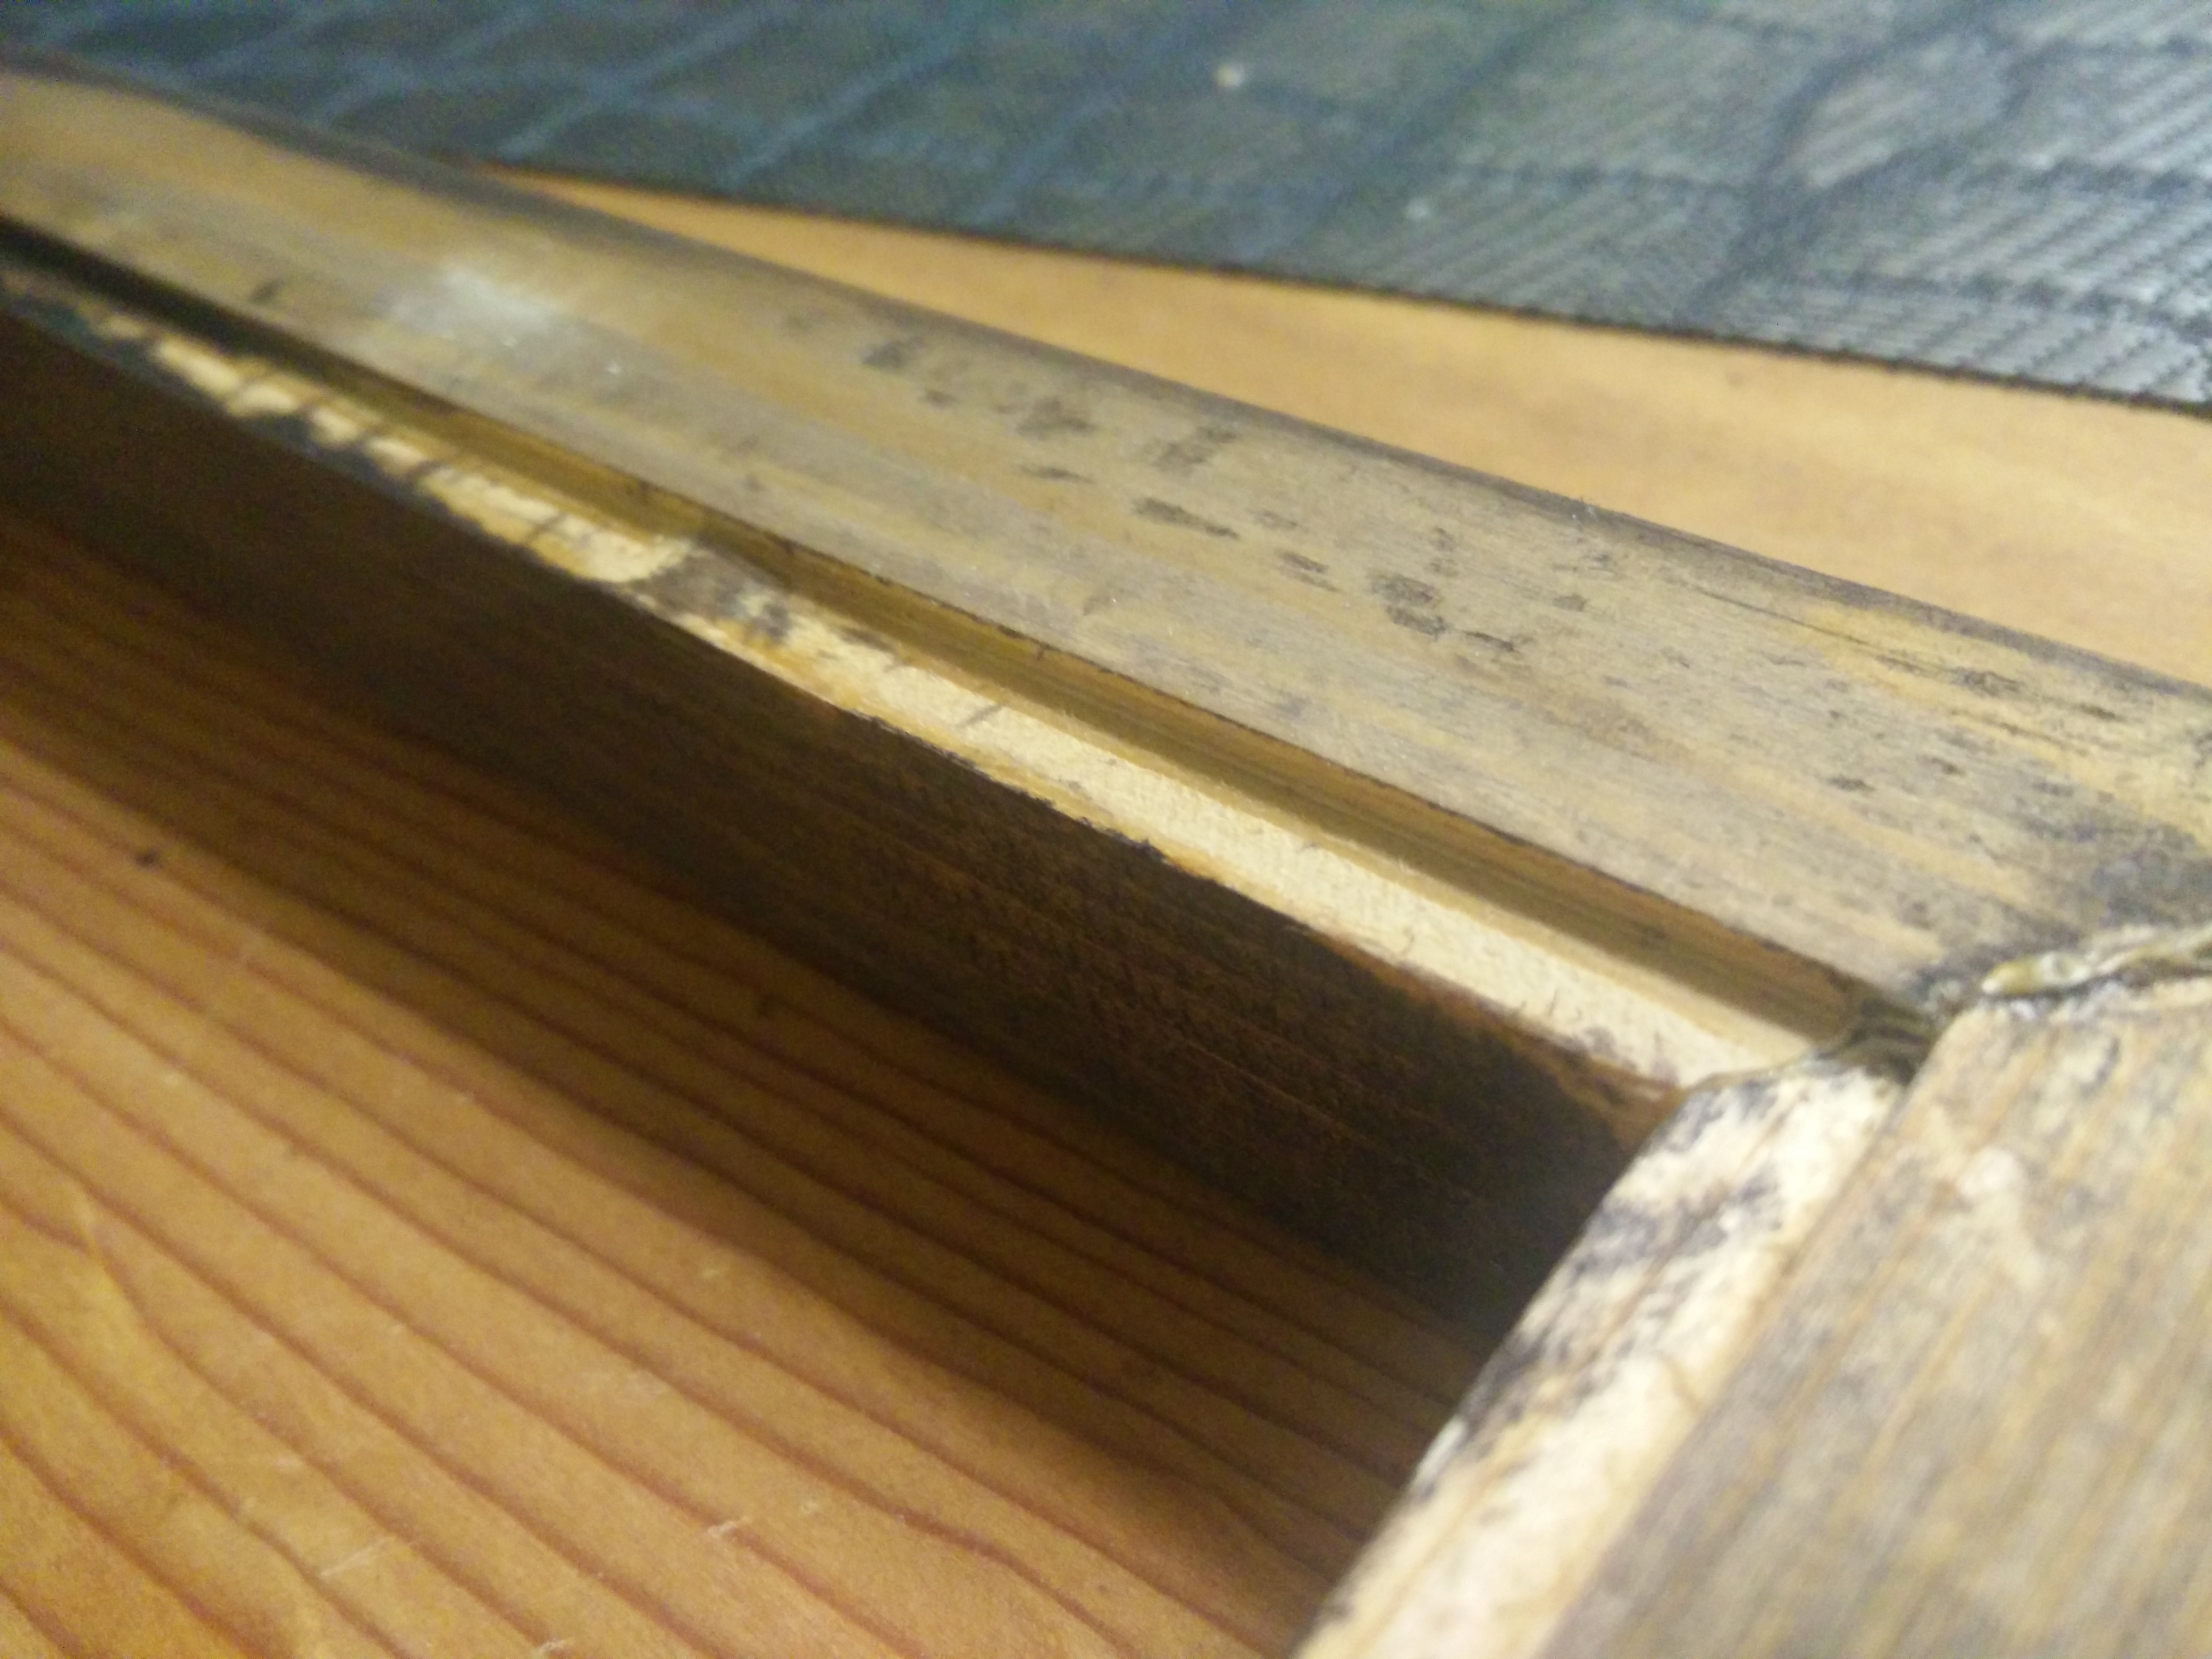
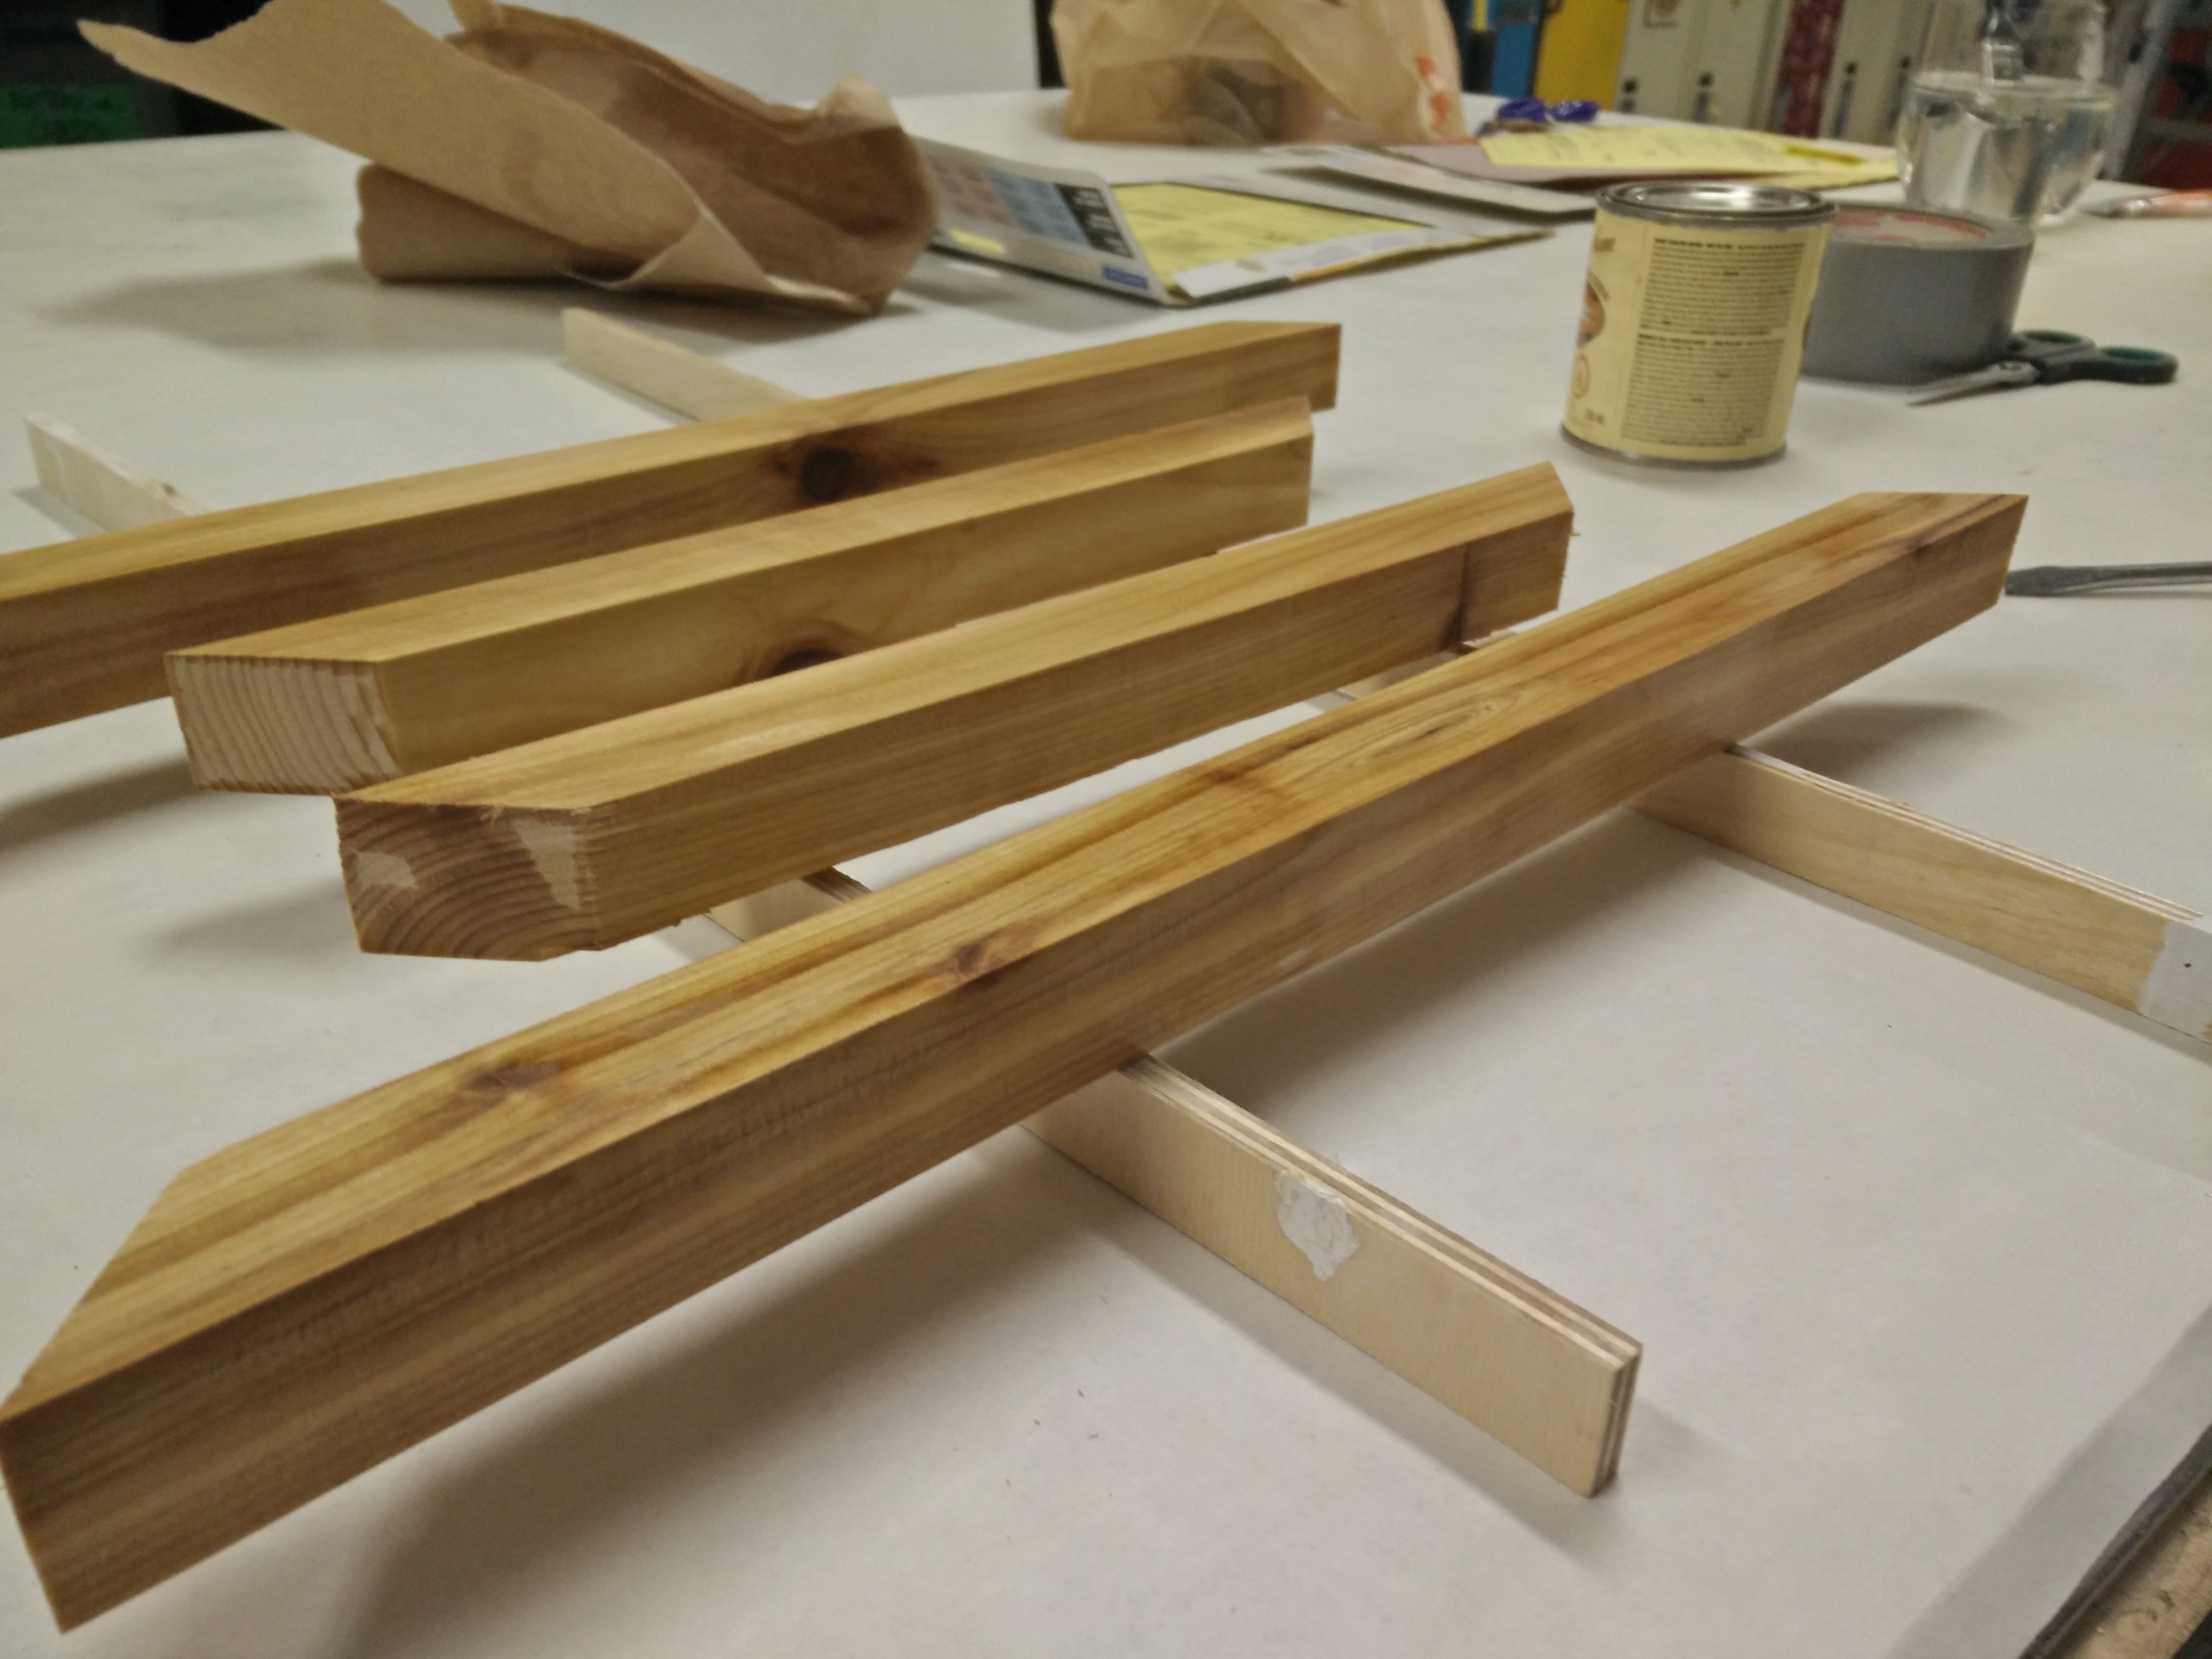
I have a few 1"x6" sitting around at home from previous projects. Fortunately, I had already planed them at makerlabs so I had a really nice surface to work with. Using the chop saw, I cut the board into the the longest length I would need (~17") and then used the bandsaw with a fence to cut 1" strips. The bandsaw we have is a bit wonky and doesn’t really do a great job of making 90 degree cuts (blade bends and warps a lot - it probably needs a tighter blade and to sure up the blade guides… never done that before but I’ll see what I can do later about this). However, I found the less-than-precise cuts a bit endearing and kept the boards as they were. I then used the table router to cut a rabbet on the inside with a depth of 1/8" and width of 1/4". This holds the map in place via the 14.5" x 9.5" plywood piece I mentioned earlier.
This is a picture of the rabbet.
Finally, all miter joints were cut on the chop saw. I was a little imprecise with everything so it took me a bit of trial and error to get everything fitting properly. I used some wood-filler to fix up my mistakes. This may have been because the boards were not perfectly squared (I could have used the table saw or borrowed use of a joiner to be more precise - for next time I guess)
I then glued all the boards together at the same time, opting to use 3 miter clamps and my hands to keep everything together. One technique that is useful is to remember that wood is incredibly absorbent. This means that if you put glue on the ends - a large amount of it will get absorbed by the board rather than stick the boards together. To combat this, put glue on the ends and don’t stick them together - instead, wait 5 minutes. Pretty much all the glue will disappear into the grain. Now put more glue on and stick them together - this should form a much stronger bond. If you are skilled, you could also use a biscuit cutter or cut a mortise and reinforce them with internal bracing. External bracing is also a good option - I got lazy and did no bracing. Hasn’t broken yet, but no guarantees.
Finally, the frame was stained and finally sprayed with varathane a few times.
Below is the boards being conditioned:
Finally I added some toggles and a string to the back with some screws…
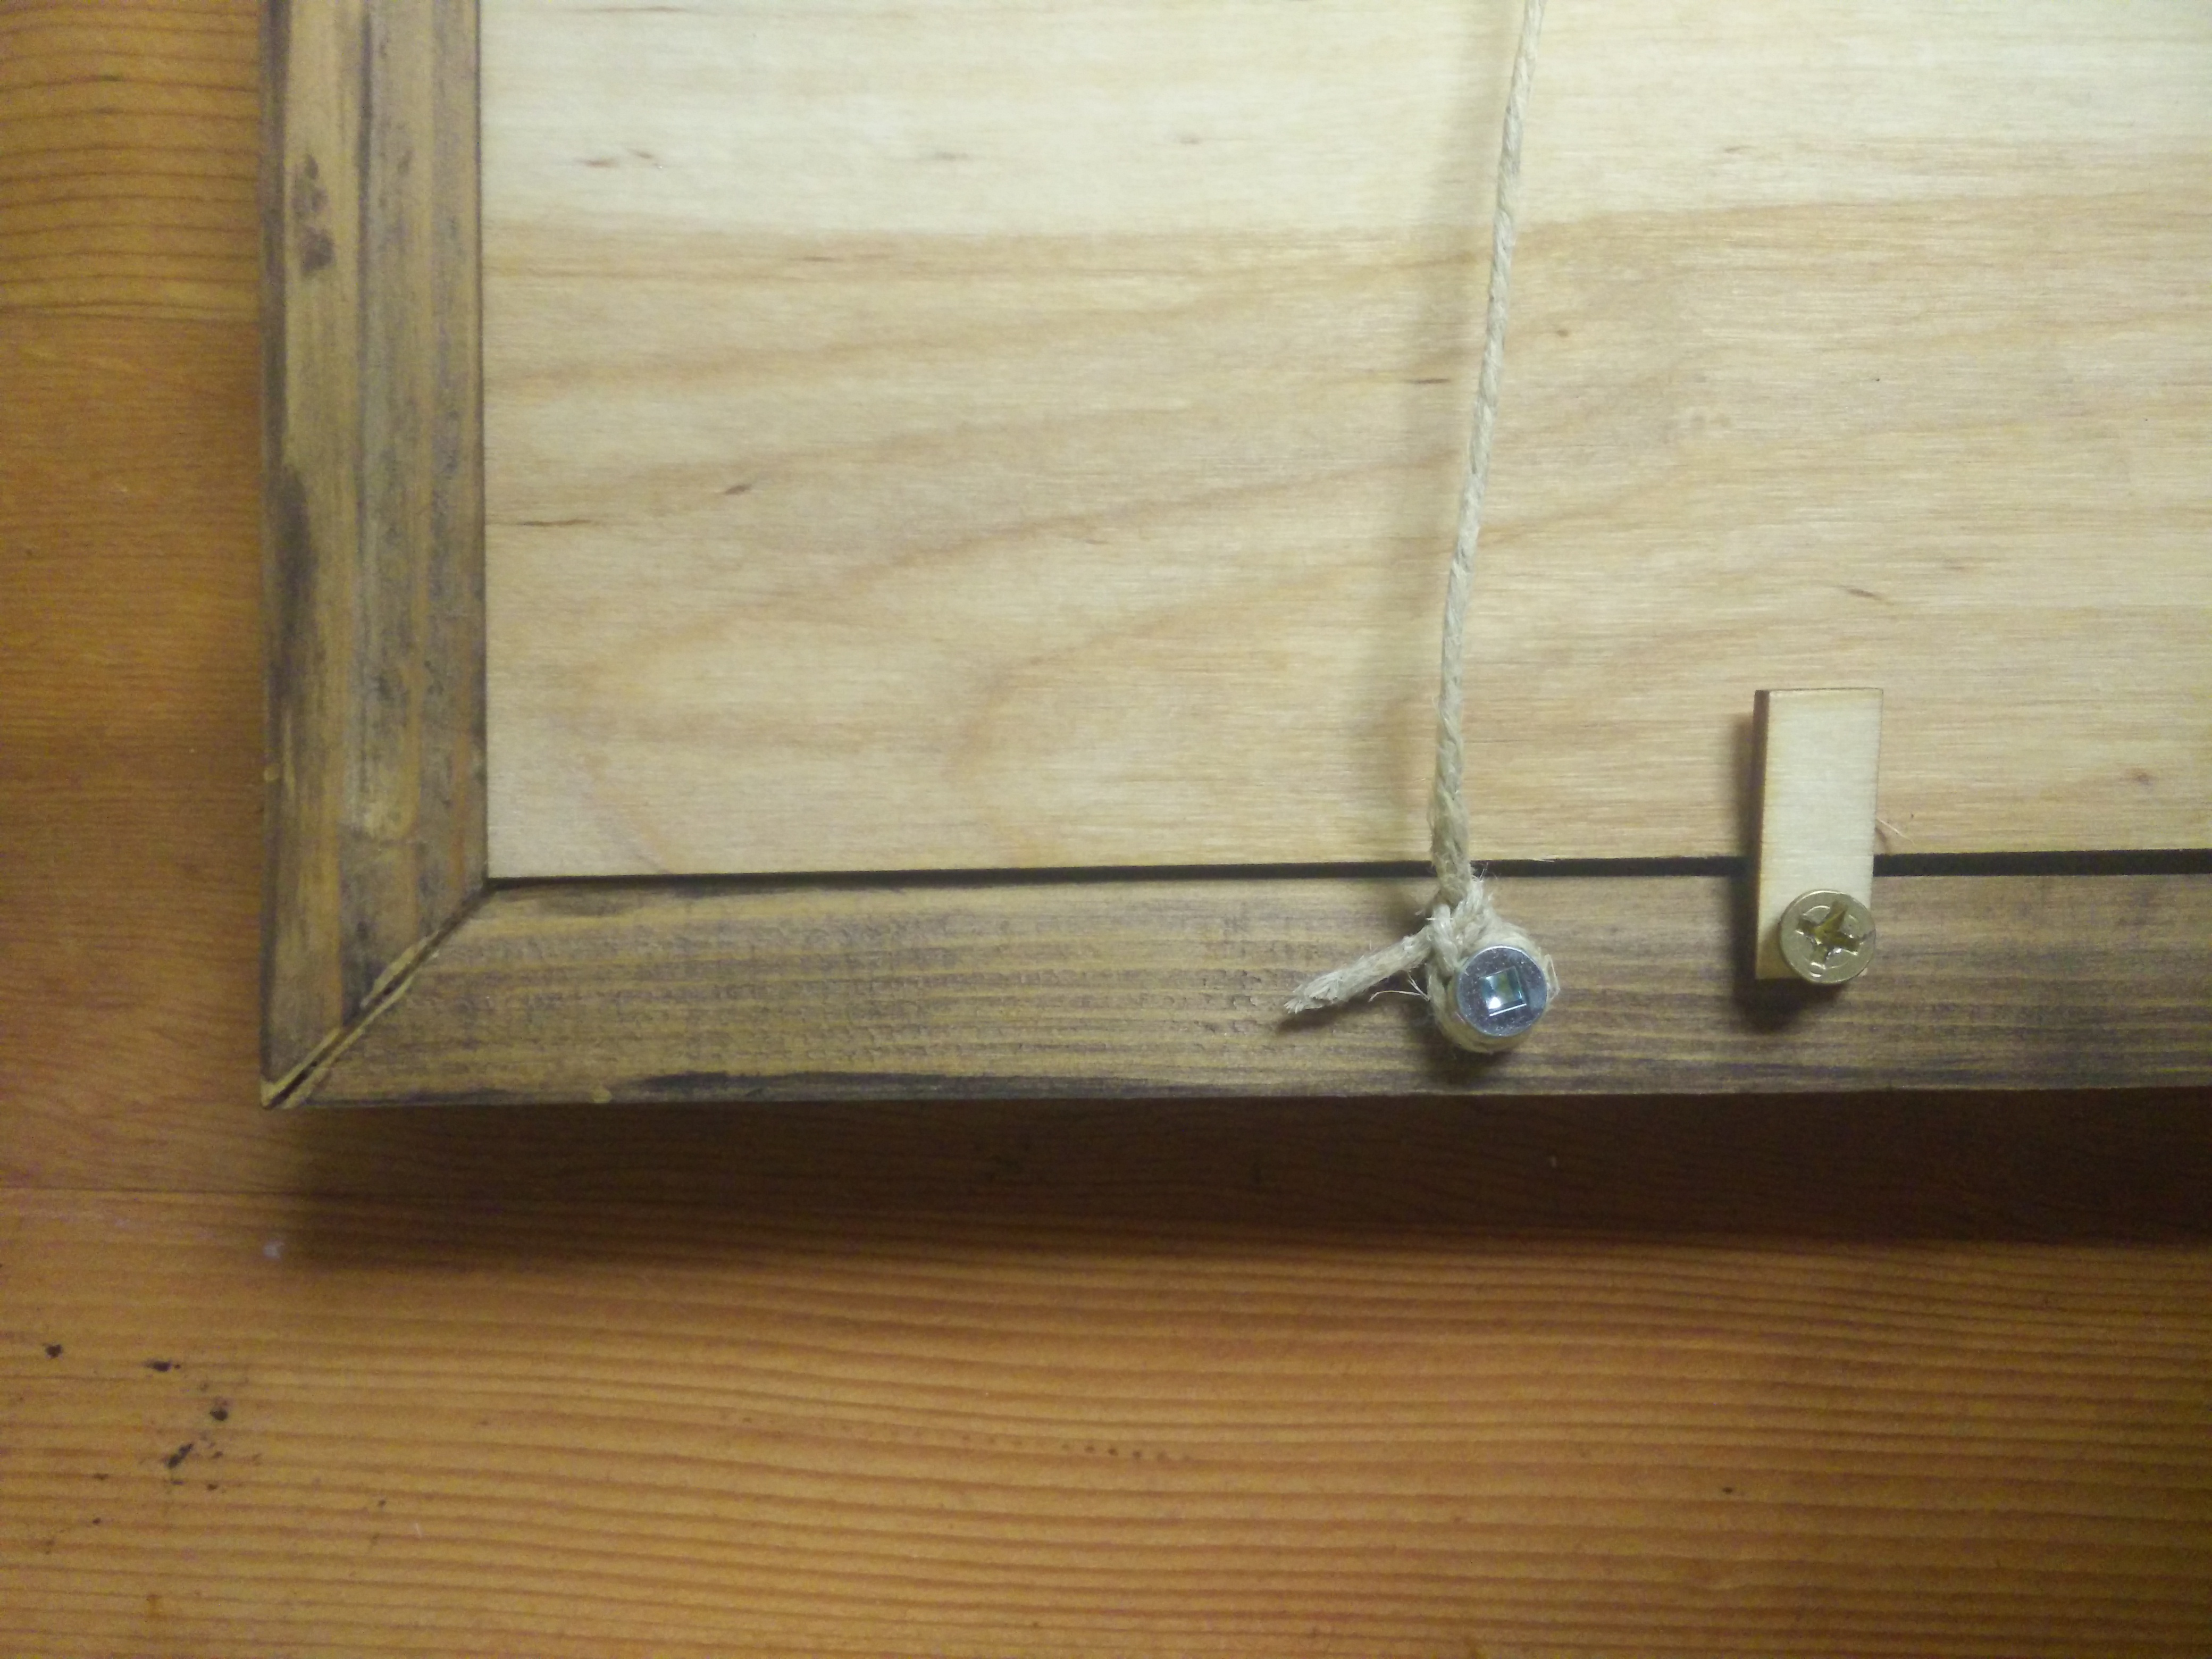
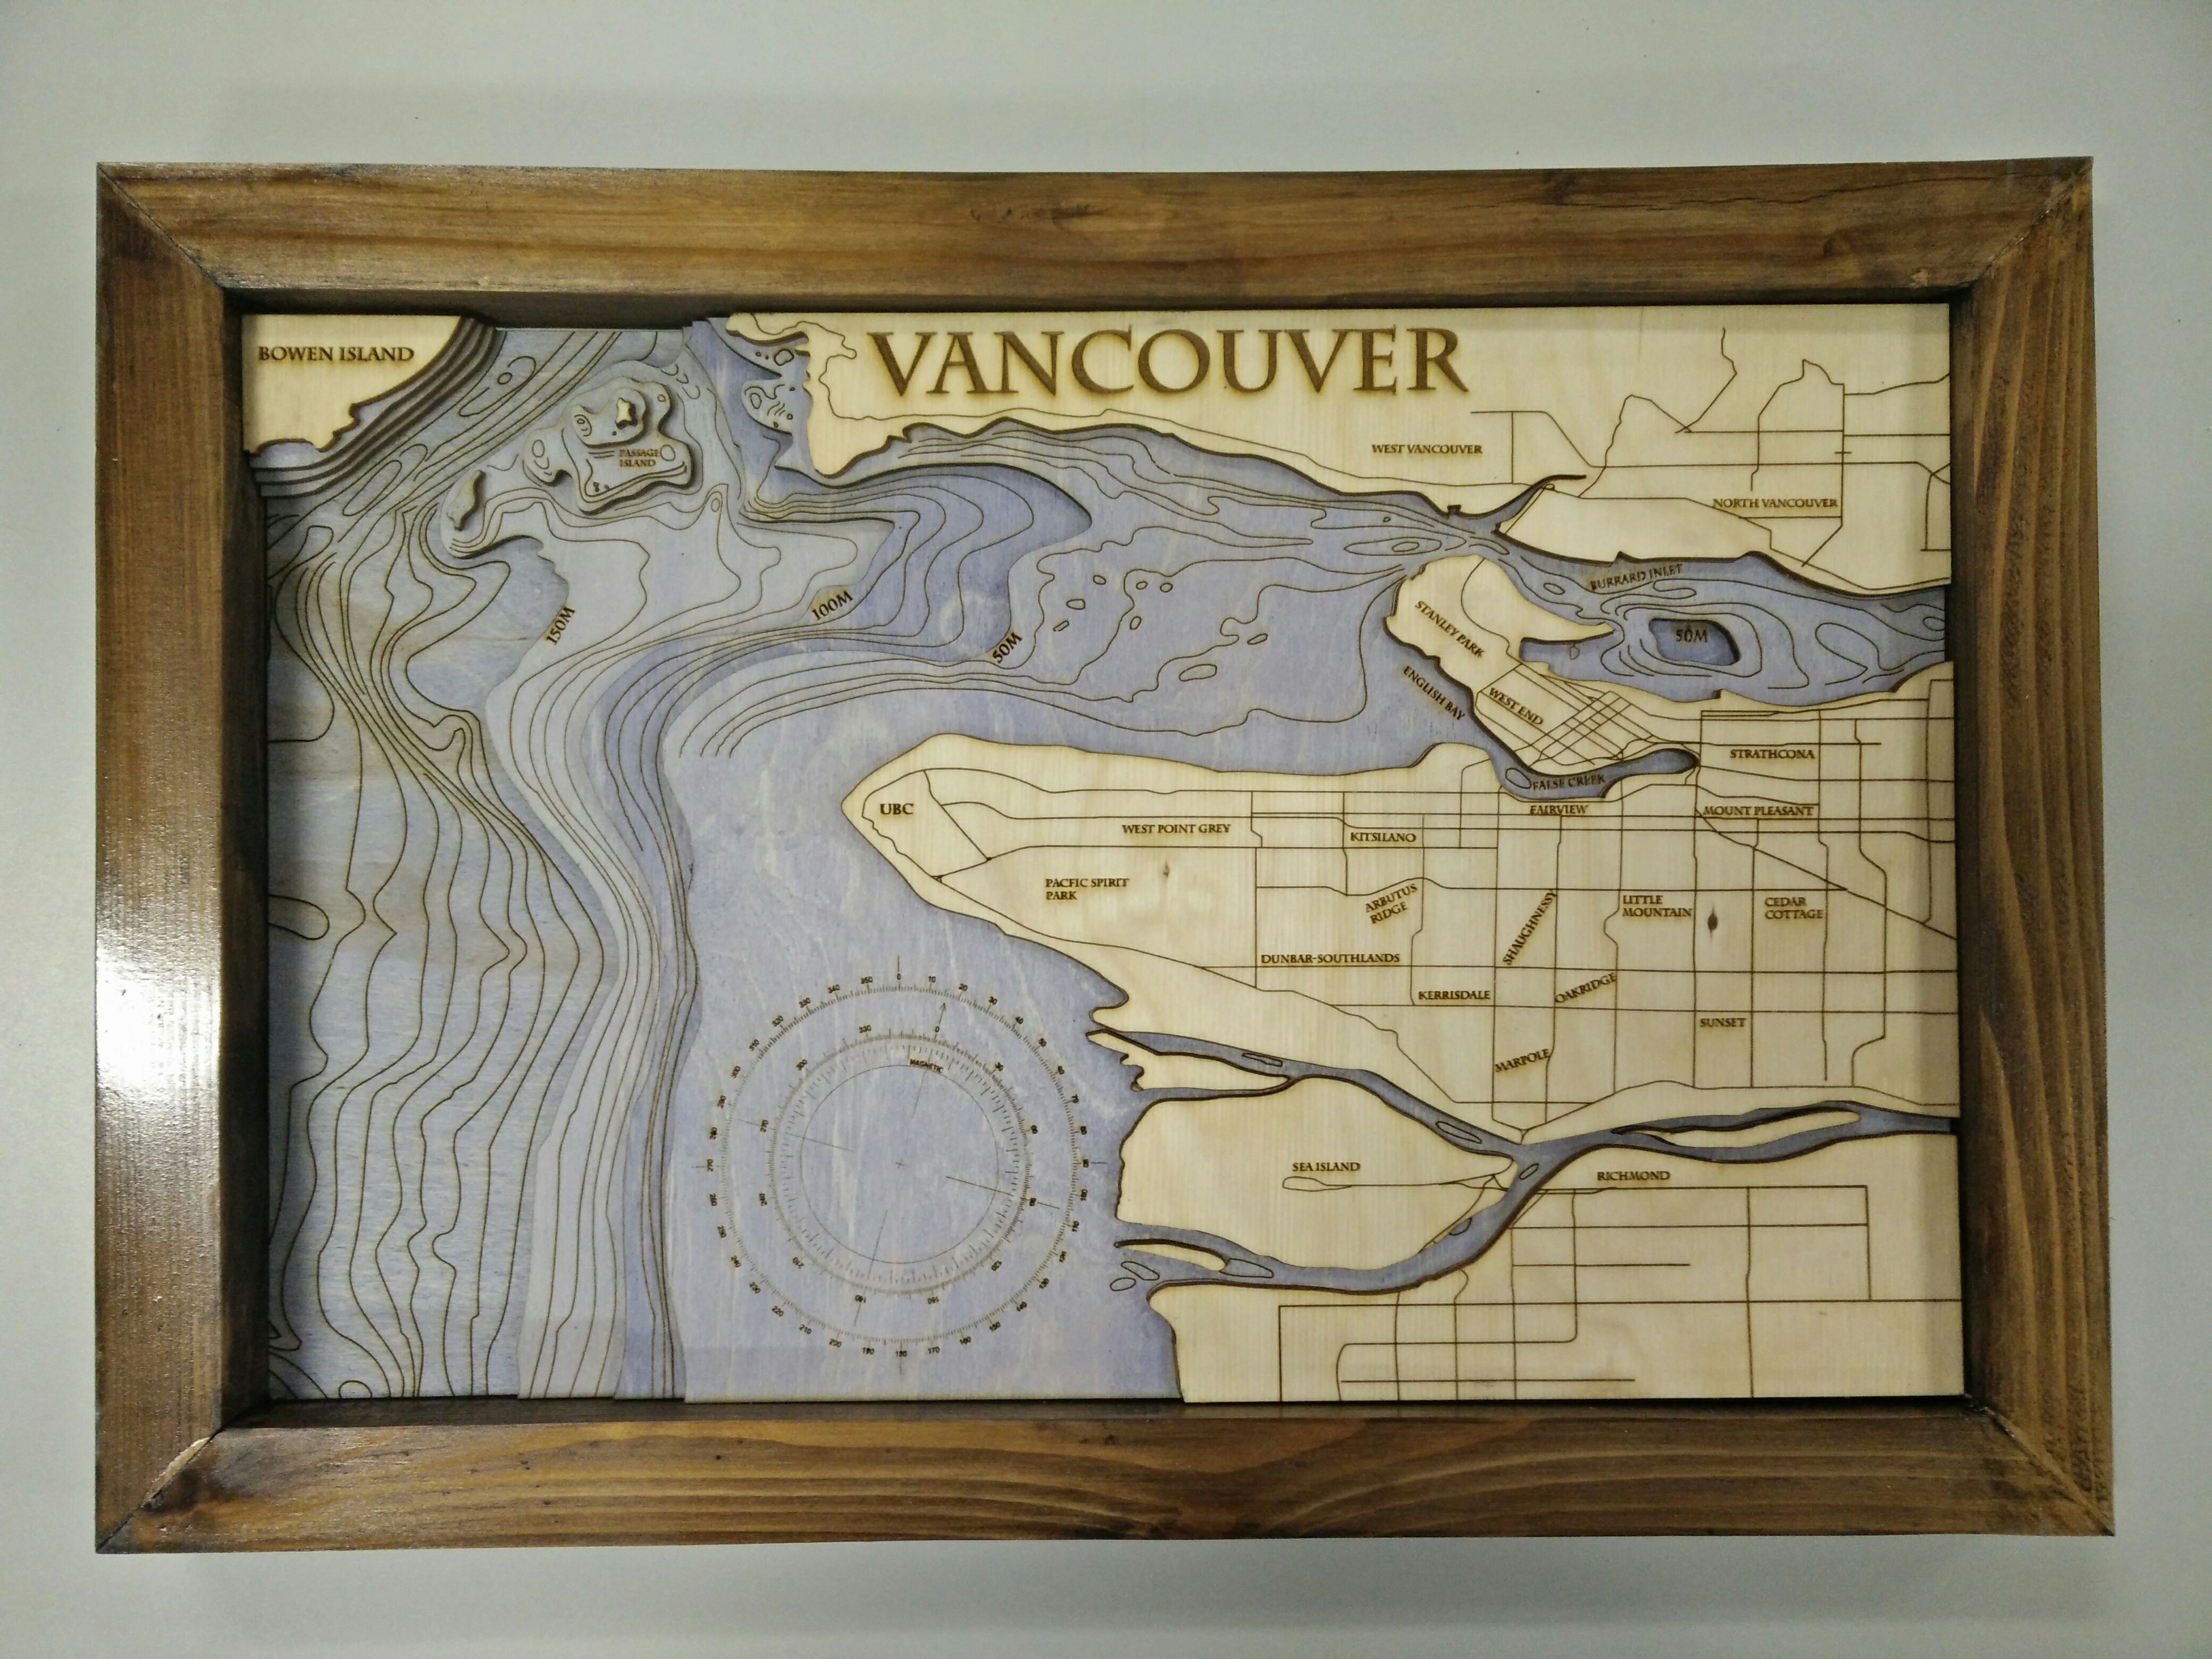
… pieced it together and BOOM - project done.